Oscillator Trading: Live Examples from Real Markets
Theory is great, but nothing beats seeing real examples in action. In this post, we'll walk through actual trades using the SimpleAlgo Oscillator across different markets.
Understanding the Display
The SimpleAlgo Oscillator shows:
Histogram - Momentum bars (green/red)
Signal Line - Orange trend line
Values - Numerical readings
Status Panels - Trend, Risk, Volume, VolatilityLive Example 1: UNI/USDT 5-Minute Chart
The Setup
Market: Uniswap (UNI) on Binance
Timeframe: 5-minute
Trend: Transitioning from bearish to bullish
What We See
Looking at the oscillator:
Trend: BEARISH (but transitioning)
Risk: NEUTRAL
Volume: LOW
Volatility: MEDIUMThe Trade
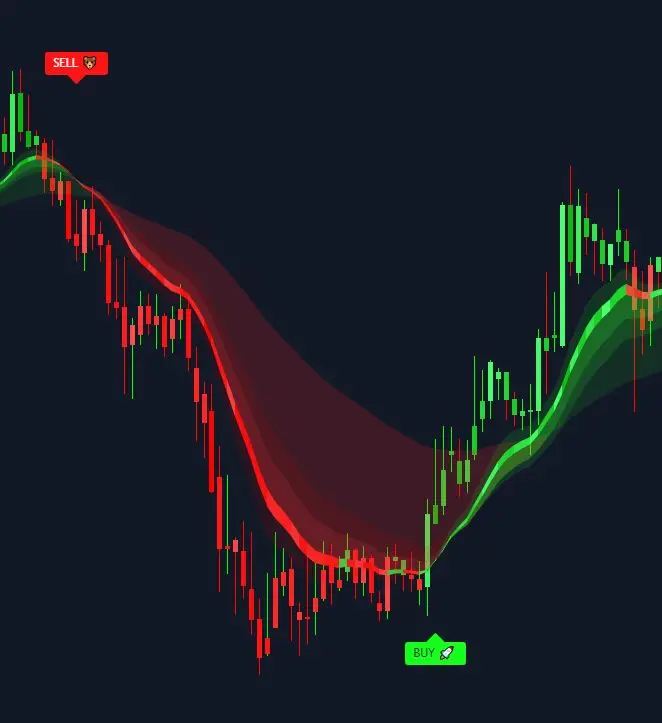
Price was in a downtrend (red cloud)
Oscillator showed bullish divergence
Green BUY signal appeared
Cloud started turning green
Entry taken on signal confirmationThe Outcome
Price rallied from 5.75 to 6.00+
TP1 hit within hours
Risk/reward: 1:3+Live Example 2: Crypto Momentum Trade
Reading the Bars
When oscillator bars are:
Tall green bars - Strong bullish momentum
Shrinking green - Momentum fading
Tall red bars - Strong bearish momentum
Shrinking red - Bearish momentum fadingThe Strategy
Wait for tall momentum bars
Enter on continuation signals
Exit when bars start shrinkingKey Oscillator Patterns
Pattern 1: Zero Line Cross
When the signal line crosses zero:
Cross up = Bullish shift
Cross down = Bearish shift
Best combined with cloud confirmationPattern 2: Divergence
Price vs oscillator disagreement:
Price higher high + oscillator lower high = Bearish divergence
Price lower low + oscillator higher low = Bullish divergencePattern 3: Extreme Readings
When oscillator reaches extremes:
Look for reversal signals
Don't trade against strong momentum
Wait for confirmationMulti-Asset Application
Stocks
The oscillator works perfectly for:
Day trading SPY, QQQ
Swing trading individual stocks
Earnings playsCrypto
Excellent for:
Bitcoin and Ethereum
Altcoins on all exchanges
Both spot and futuresForex
Great for:
Major pairs (EUR/USD, GBP/USD)
Cross pairs
All timeframesTips for Oscillator Trading
Tip 1: Match Timeframe
Scalping: Focus on 1-5 min oscillator
Day trading: Use 15-30 min readings
Swing trading: Prioritize 4H-DailyTip 2: Confirm with Cloud
Always check:
Oscillator AND cloud should agree
Don't trade oscillator signals against the cloud
Use cloud for bias, oscillator for timingTip 3: Watch the Panels
Status panels give quick reads:
All bullish = Strong long bias
All bearish = Strong short bias
Mixed = Wait for clarityConclusion
The SimpleAlgo Oscillator is a powerful tool when used correctly. These real-world examples show exactly how to apply it to your trading.
Practice on demo accounts first, then apply to live trading with proper risk management.