Fibonacci Retracements: The Ultimate Trading Guide
Fibonacci retracements are one of the most powerful tools in technical analysis. Based on mathematical ratios found throughout nature, these levels help traders identify potential reversal zones with remarkable accuracy.

Understanding Fibonacci Numbers
The Fibonacci sequence (0, 1, 1, 2, 3, 5, 8, 13, 21, 34, 55, 89...) creates ratios that appear throughout nature and financial markets:
23.6% - Shallow retracement, strong trend
38.2% - Common retracement in trending markets
50% - Psychological midpoint (not a true Fibonacci ratio)
61.8% - The "Golden Ratio," most significant level
78.6% - Deep retracement, often last line of defenseHow to Draw Fibonacci Retracements
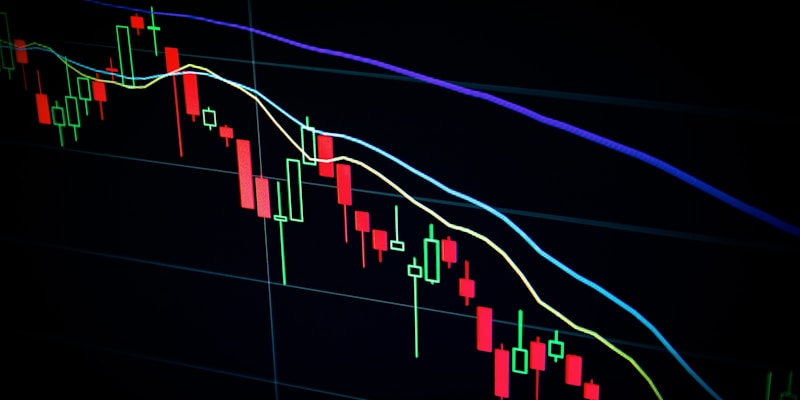
In an Uptrend
Identify a significant swing low
Identify the swing high
Draw from the low to the high
Retracement levels appear between these pointsIn a Downtrend
Identify a significant swing high
Identify the swing low
Draw from the high to the low
Retracement levels appear between these pointsKey Trading Strategies
The 61.8% Bounce Strategy
The 61.8% level is considered the "golden pocket" by many traders:
Wait for price to retrace to the 61.8% level
Look for bullish candlestick patterns (hammer, engulfing)
Confirm with volume increase
Enter with stop-loss below 78.6%
Target the previous high or Fibonacci extensions
Fibonacci Confluence
When Fibonacci levels align with other technical factors, the probability of a reversal increases:
Fibonacci + horizontal support/resistance
Fibonacci + moving averages
Fibonacci + trend lines
Fibonacci + previous swing pointsFibonacci Extensions
Extensions help identify profit targets beyond the original move:
127.2% - First extension target
161.8% - Common profit target
200% - Extended move target
261.8% - Extreme extensionUsing Extensions for Profit Targets
After price bounces from a retracement level
Apply Fibonacci extension tool
Use 127.2% and 161.8% as profit targets
Scale out of positions at each levelCommon Mistakes
Forcing Fibonacci on every chart: Only use on clear, significant swings
Ignoring the trend: Fibonacci works best with the trend
Not waiting for confirmation: Don't blindly buy at levels
Using too many timeframes: Start with one, then confirm with othersSimpleAlgo Integration
SimpleAlgo automatically identifies key Fibonacci zones and alerts you when price approaches significant levels, removing guesswork from your analysis.
Conclusion
Fibonacci retracements are essential for any serious trader. Practice identifying levels on historical charts, combine with other indicators, and always wait for confirmation before entering trades.